Last week, I posted a cryptic appeal to my followers on Linkedin to participate in a brief survey that connected to my graduate course Customer Insights & Analysis at the USC Marshall School of Business. I didn’t provide much detail–just that it was part of two experiments. I promised to share the results. This post makes good on that promise.
Making an important lesson more real
I’ve taught this course for over five years, and it continues to challenge and inspire me. Students come from a variety of backgrounds. Some arrive from data science, others from business or marketing. Each brings different skills and blind spots. That makes it essential for me to find fresh, tangible ways to explain the nuances of customer research.
The course unfolds in three modules:
Research Design and Metrics
Qualitative Methods (interviews, focus groups)
Quantitative Methods (survey research, first-party data)
This semester, I used the kickoff of the qualitative module as a launchpad to teach about heuristics. Heuristics are mental shortcuts that influence how people respond to research questions.
A live experiment around heuristics
To demonstrate heuristics in action, I ran a simple experiment using two of the most impactful ones:
Anchoring–When initial information (even irrelevant) affects future judgments.
Representativeness–When people make judgments by relying on the most accessible or vivid idea that comes to mind—often a stereotype or prototype—without considering whether that example is representative of the broader category or population.
Participants (students and kind LinkedIn volunteers) were randomly assigned to control and treatment conditions.
Anchoring Condition
Control:
Q: What do you think is a reasonable price for a large specialty coffee drink at an independent coffee shop near campus?
Treatment:
Q: The most expensive coffee drink at the campus Starbucks costs $8.50. Now, thinking about coffee pricing in general, what do you think is a reasonable price for a large specialty coffee drink at an independent coffee shop near campus?
Both participants were asked to enter a price in an open-ended text field.
Representativeness Condition
Control:
Q: Meet Alex: They are an undetgraduate student here at USC. What do you think Alex’s GPA is most likely to be?
Treatment:
Q: Meet Alex: They are an undegraduate student here at USC. They spend 6+ hours daily playing video games, often stay up until 3 AM gaming, have gaming posters all over their dorm room, and can discuss the latest game releases for hours. Alex is known around his residential college as ‘the gamer.’ What do you think Alex’s GPA is most likely to be?
Participants were then shown five options representing an even distribution of possible grade point averages. It should be noted that my friends who were researchers and assigned to the experimental condition smelled a rat. But they played along anyway. Keep in mind that participants didn’t know they had been sorted into groups or that there was a different question. They only saw the questions that matched their sorted condition.
In order for the experiment to work, I needed to have about 60 people take the survey, but there are only 52 students in my class, which is why I asked Linkedin to come to the rescue. You did, and it didn’t disappoint.
Anchoring the price of coffee
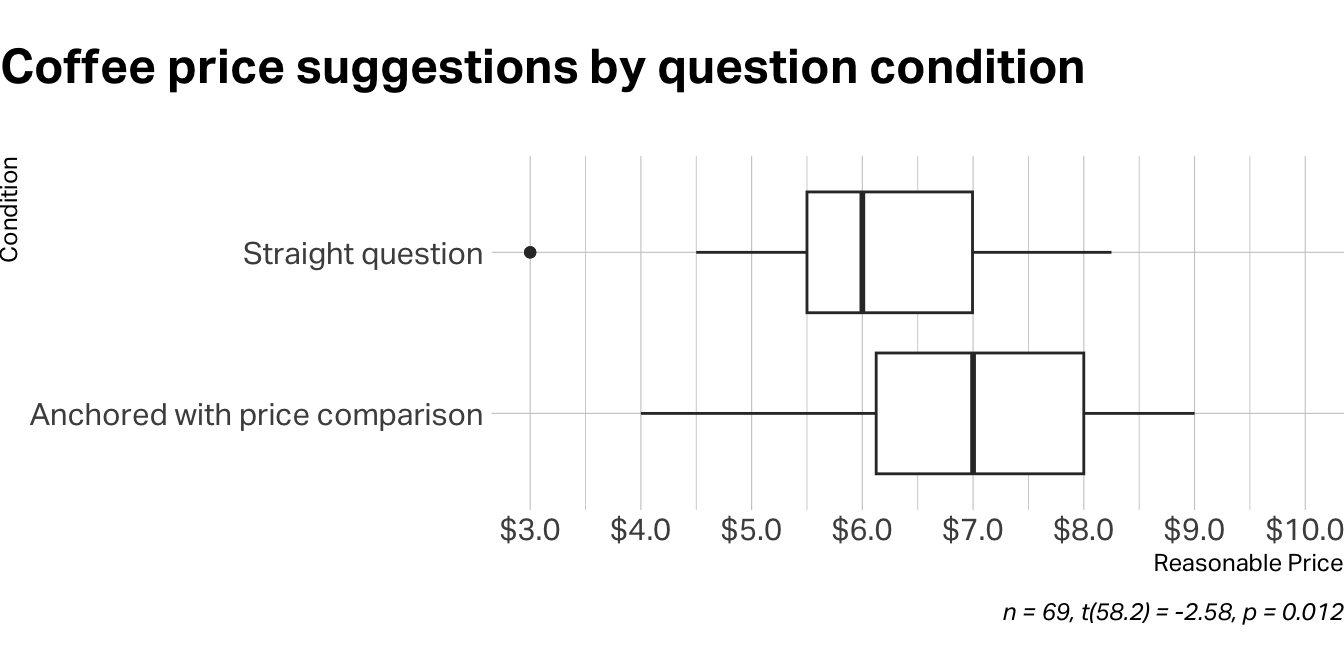
What happens when a question about a reasonable coffee price on campus is anchored with a high price point, in this case $8.50? Take a look.
Participants in the control group suggested that $6.11 was a reasonable price for a large specialty coffee drink at an independent coffee shop near campus. Those shown the $8.50 anchor as the most expensive coffee drink on campus suggested that a reasonable price would be $6.90, on average. The difference between the two was statistically significant.
Estimating an undergraduate’s GPA based on stereotypes
For the representativeness experiment the truth is that both conditions deal with a stereotype. The control condition relies upon pre-conceived notions participants might have about the academic proficiency of a USC undegrad. But the second question teases out yet another stereotype: what participants might believe about students who play a lot of video games. To be honest, I laid it on thick, suggesting that this particular student plays more than 6 hours a day, staying up late, and being such an avid player that they’re known as “the gamer.”
Let’s see if this description affected participant perceptions of Alex’s GPA.
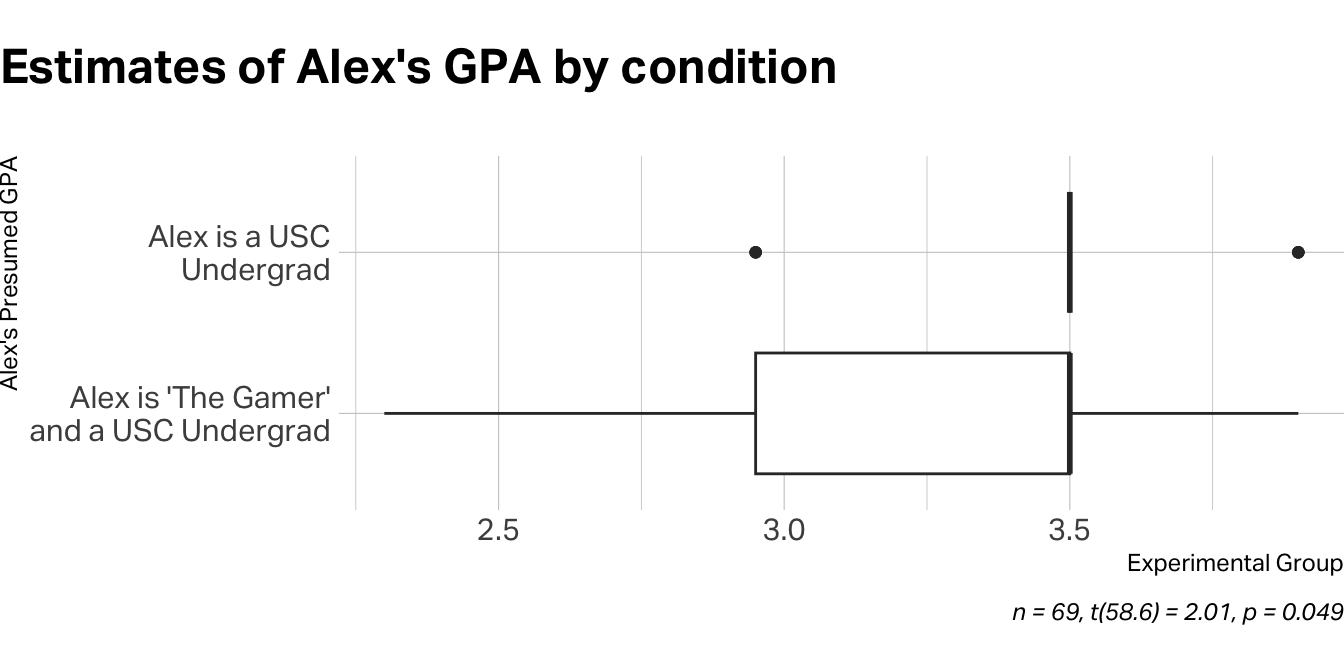
Indeed, it did. Participants in the control group assumed a 3.5 GPA, on average, while those in the experimental group assumed a lower GPA of 3.3. Again, the results were statistically significant.
The results
As I’d hoped, showing students these results made the affect of heuristics like anchoring and representativeness more real-world. I could see it in their faces and hear it in the few “oohs” and “ahhs” murmuring in the classroom. The demonstration also served a secondary purpose of showing students why experiments are valuable in customer research. Since students must ultimately design an experiment for their group projects, I’m trying to demonstrate how these are done at as many at-bats as I can.
You might wonder why I used statistical tests to demonstrate heuristics that can plague qualitative research. The answer is practical: numbers don’t lie, and they certainly don’t let students dismiss inconvenient truths about human psychology. Most of my class this term are MSBA students who speak fluent spreadsheet but are still learning to decode the messiness of human behavior. Showing them a p-value of 0.003 lands differently than me waving my hands about “cognitive bias.” But make no mistake—anchoring and representativeness are absolutely critical in qualitative work. When the first focus group participant mentions price as their primary concern, suddenly everyone is talking about price, even though unprompted research might reveal that convenience or quality matter more. Similarly, if I describe a customer segment using certain demographic markers before asking about their preferences, I’ve inadvertently activated representativeness, causing participants to respond based on stereotypes rather than genuine insights. The quantitative proof just makes it harder for future researchers to ignore these very real qualitative pitfalls.
Ulterior motive
There was a second experiment happening here: a workflow experiment.
For years, I’ve been on a mission to make my customer research workflow fully programmatic—from survey design to delivery, analysis, and presentation.
Thanks to Quarto and R, I’ve already replaced PowerPoint, Keynote, and Google Slides. I generate all my visualizations and slides with code. When I update the data, everything updates automatically.
But survey data collection has been a weak link … until now.
This study was built entirely in R using the surveydown1 package. No Qualtrics. No Google Forms. Just R code. I created and deployed the survey, collected data, and analyzed results all in one place.
Performance wasn’t perfect (the survey was a bit slow), so it’s not quite client-ready. But it worked beautifully for this kind of classroom experiment.
Final Thoughts
Thanks to all who participated. You helped bring an abstract concept to life and gave students a real-world reminder that even the most well-intentioned research can go sideways if we’re not careful with design.
We live in an exciting era for customer research. Tools are getting better. Data is more accessible. And yet, human psychology still requires us to tread carefully.
Mind your anchors. Mind your stereotypes. And mind the gap between intention and insight.
Footnotes
Hu P, Bunea B, Helveston J (2025). “surveydown: An open-source, markdown-based platform for programmable and reproducible surveys.” PLOS One, 20(8). doi:10.1371/journal.pone.0331002↩︎